[Map of Europe]


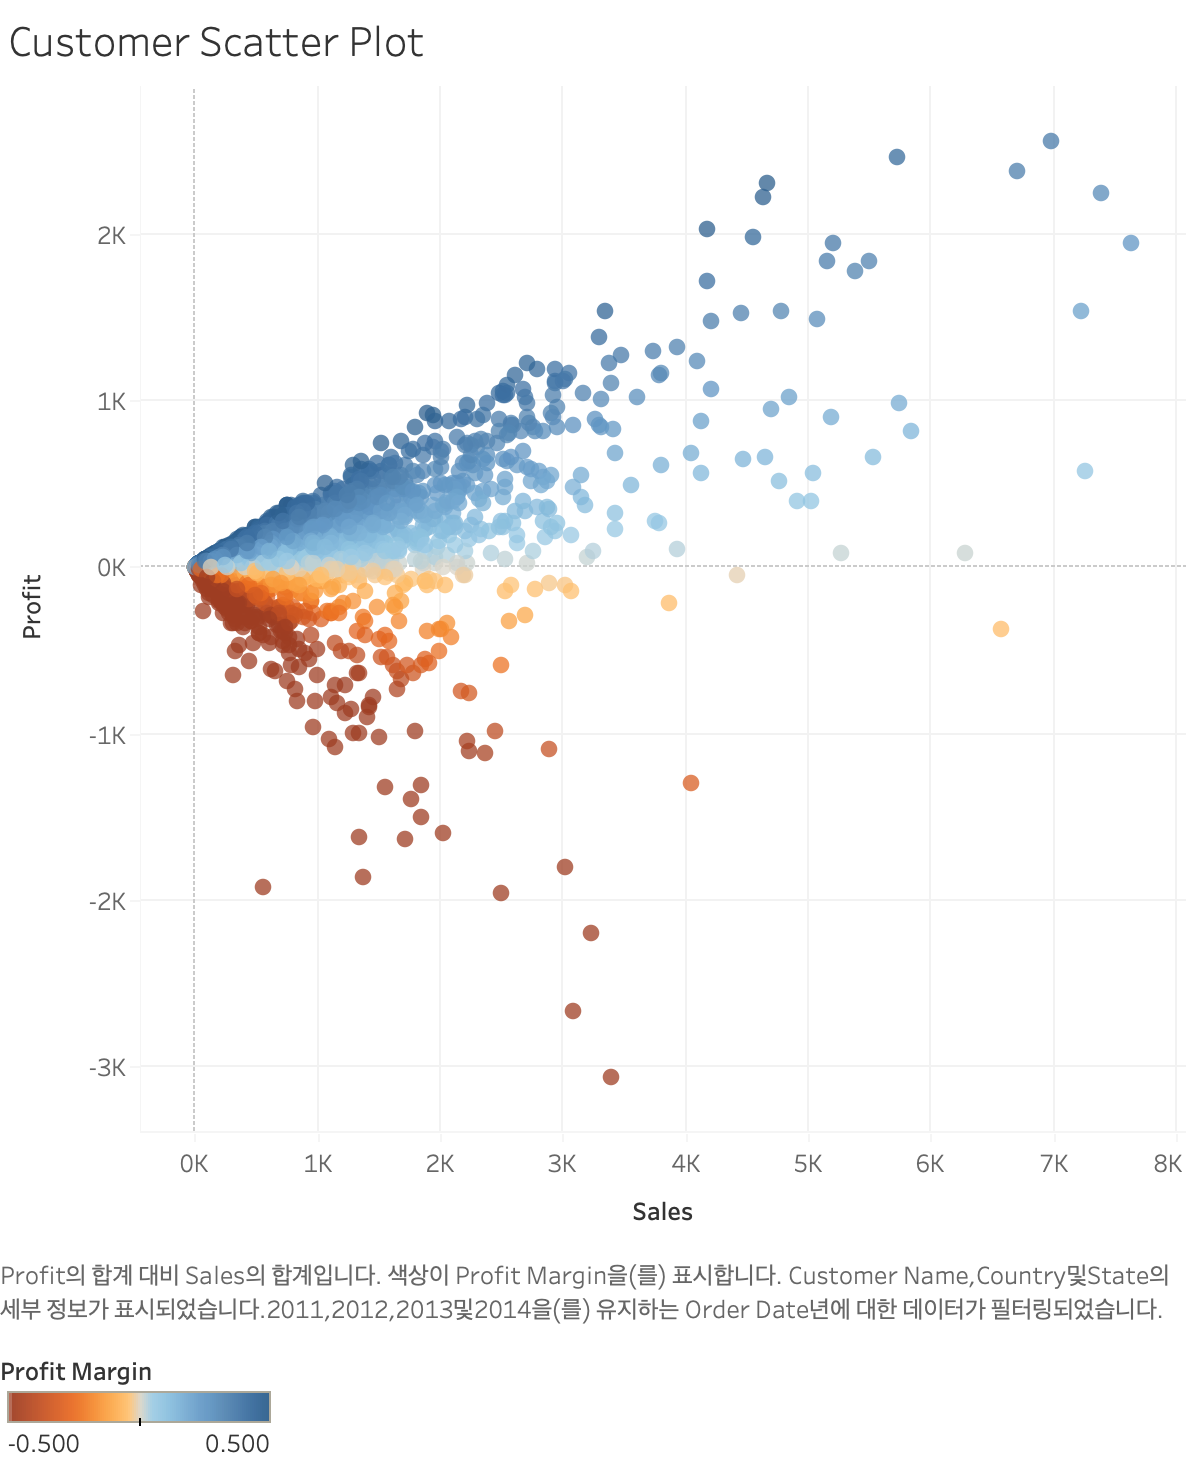
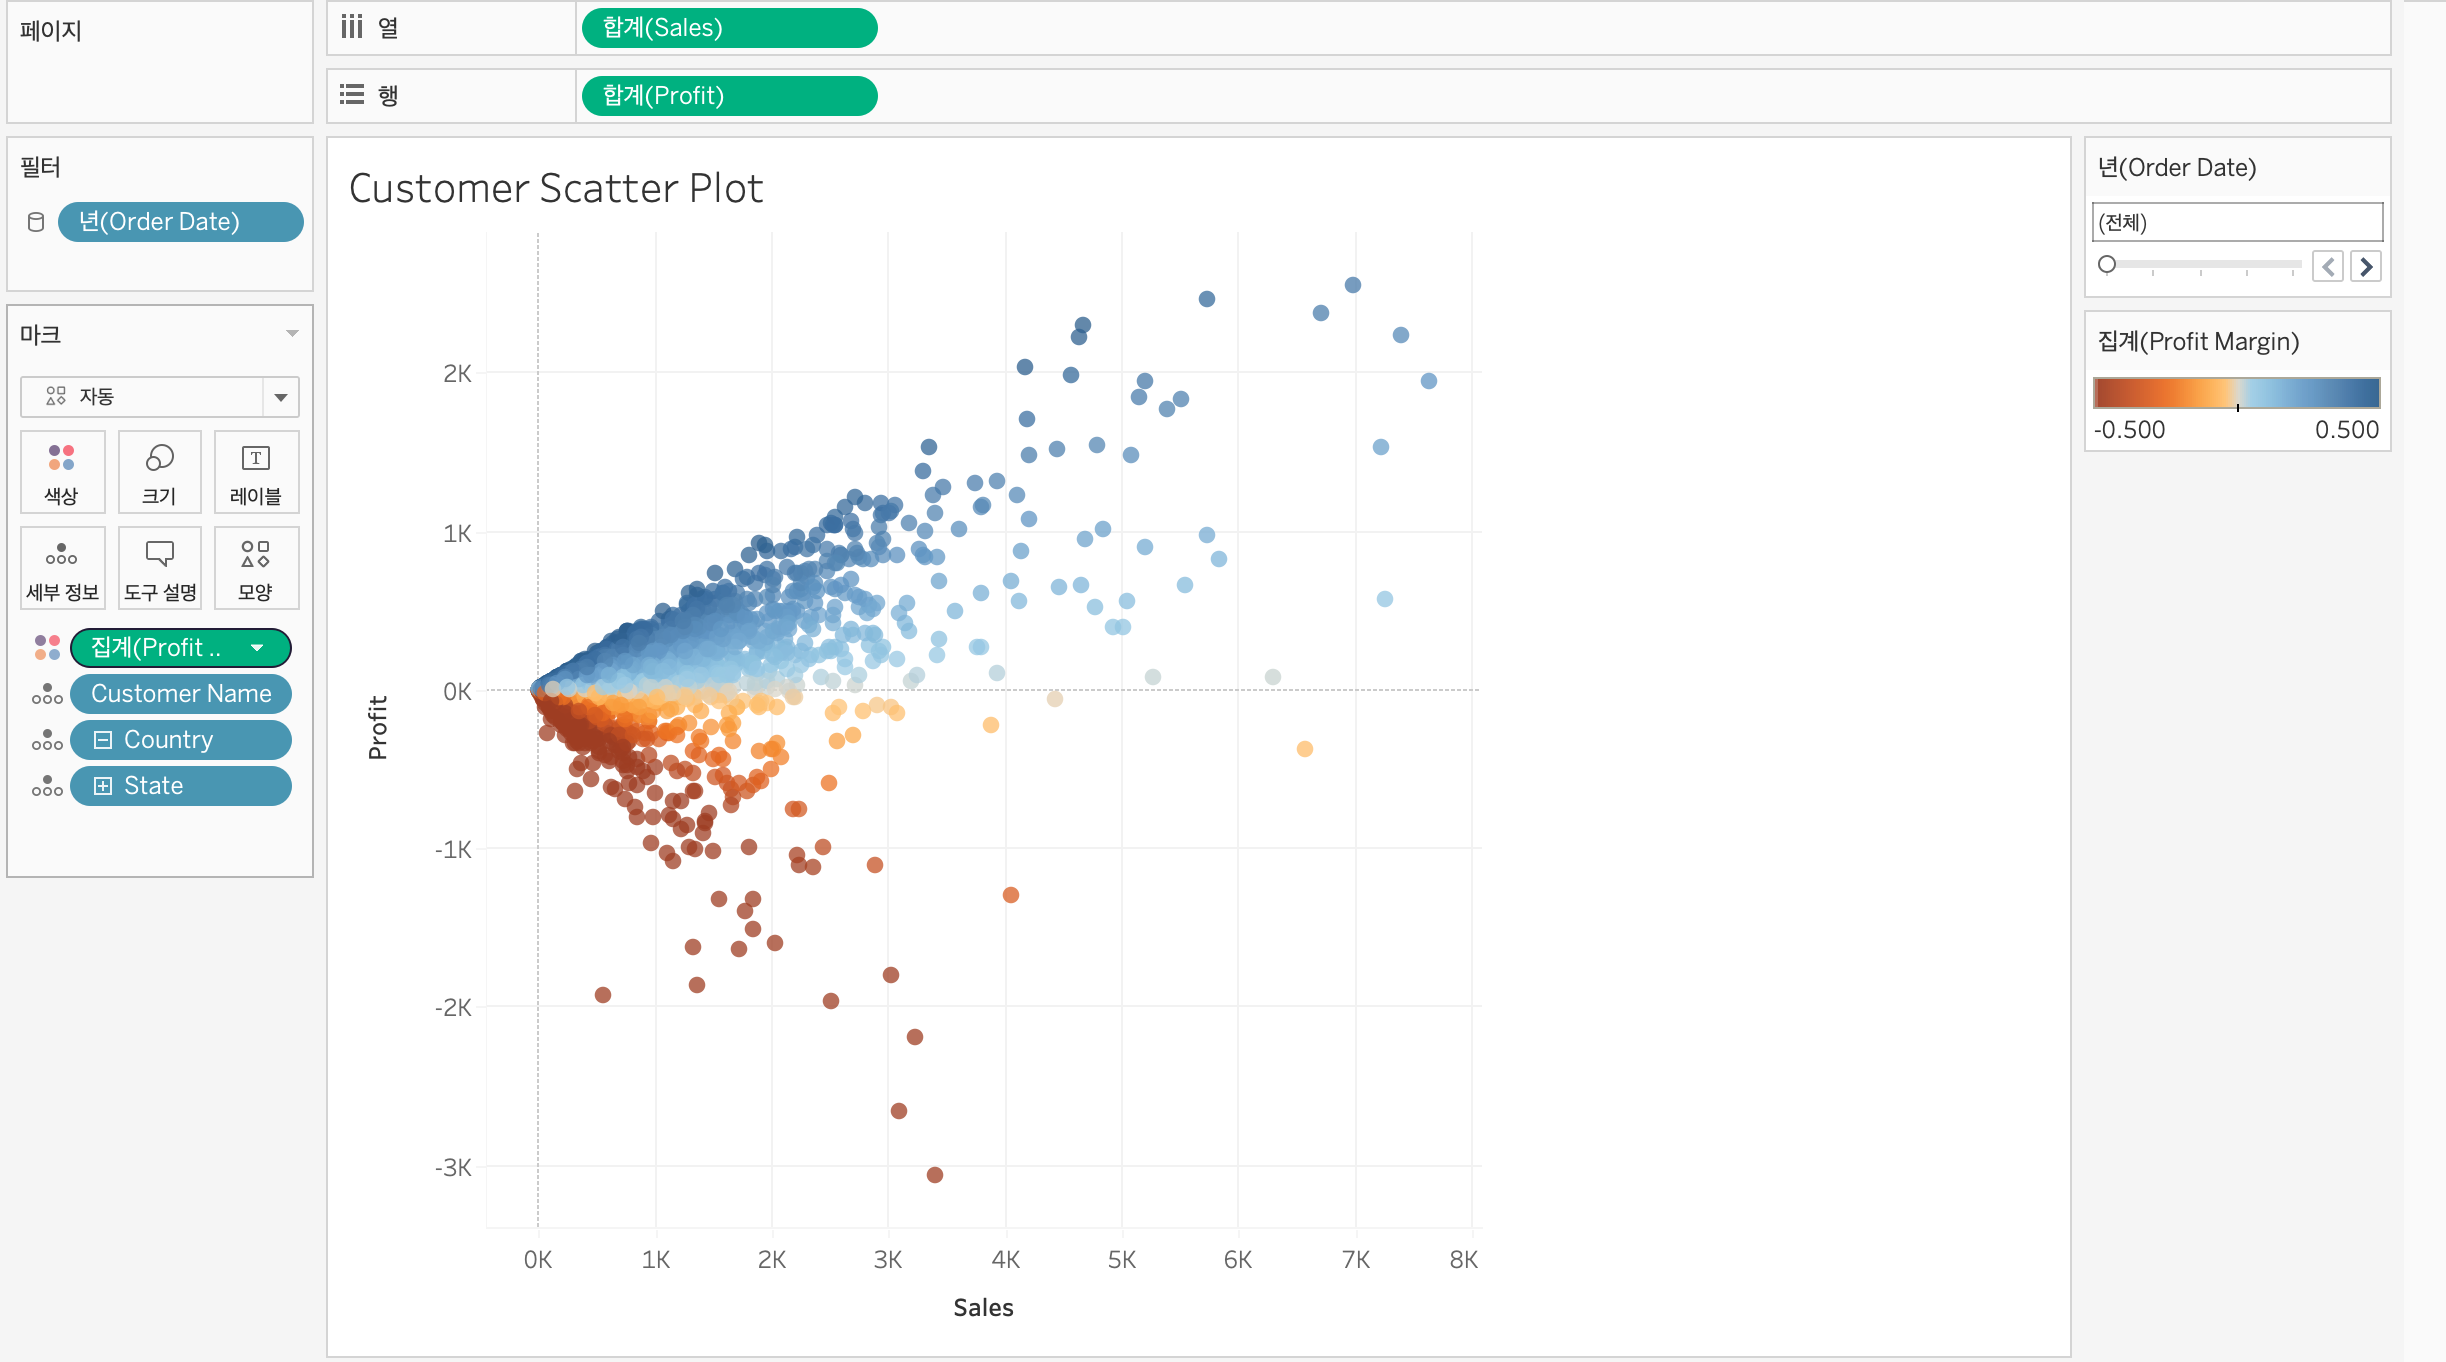
[Customer Scatter Plot]
[대시보드]
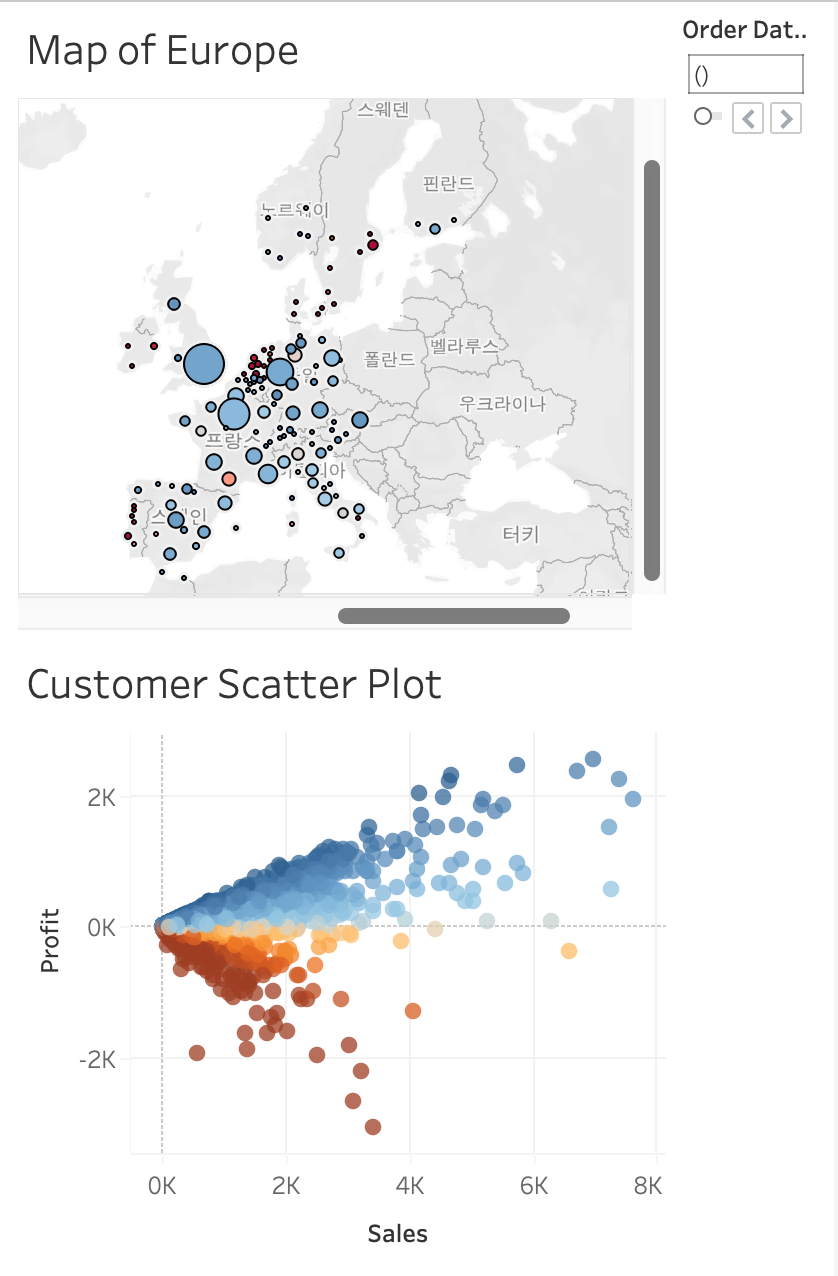
대시보드-동작(액션) : 두 데이터 간 실제 연동 가능. 한 데이터 클릭시 다른 데이터 표시 등.
'Visualization > Tableau' 카테고리의 다른 글
| Amazing mart Monthly targets and Sales (0) | 2022.07.15 |
|---|---|
| Long-term-Unemployment-Statistics (0) | 2022.07.15 |
| Annual Bonus Analysis (0) | 2022.07.12 |


